How biased are text-to-image models?
Published:
Last semester, members from various Cornell Data Science subteams set out to answer two questions: how can we detect bias in machine learning? Not only that but can we mitigate these social biases that the machine is replicating? To answer these questions, we looked at two text-to-image-generation models: CLIP+ and DALL-E. The images generated by these models demonstrated identity biases (i.e. race, gender, religion, etc.) surrounding classifiers ranging from criminals to teachers. This can lead to huge ramifications. For example, an AI interview system could determine that a certain identity does not look fit for the job based on trivial aspects of their background. Hence, it is critical to creating detection and mitigation measures to ensure CLIP+ and DALL-E generate representative and non-skewed images to reduce the possibility of unfair decisions.
Generation Procedure
Our project started with detecting biases in our data in DALL-E. This was done both manually and automatically. With manual detection, we analyzed the data and decided if there was a reflection of bias in the data. With automatic detection, we ran analyses to look for anything that would show bias in data.
We had DALLE generate 100 images based on different prompts. The prompts follow this sentence structure “a photo of _____” –– typically male or female-dominated professions, like doctors for males and nurses for females. After these images were generated, we had two members label each image as male, female, or unsure, and we took the majority count. If there was disagreement between the members on the label classification, the image would be dropped from the data. After this classification, there were a total of around 80 images that had labels of either male or female.
| Input prompt: “A photo of a doctor” | Input prompt: “A photo of a nurse” |
|---|---|
 |  |
We found that the DALL-E-generated images reflected a significant bias in these professions. In the images, there were 2.35 male doctors to every 1 female doctor represented. This exacerbates the real-world bias since, in the United States, there are 1.78 male doctors to every 1 female doctor. Similarly, for nurses, the ratio is 0 because DALL-E did not generate any male nurses. In the US, there are 0.11 male nurses to every 1 female nurse.
Measuring The Gap
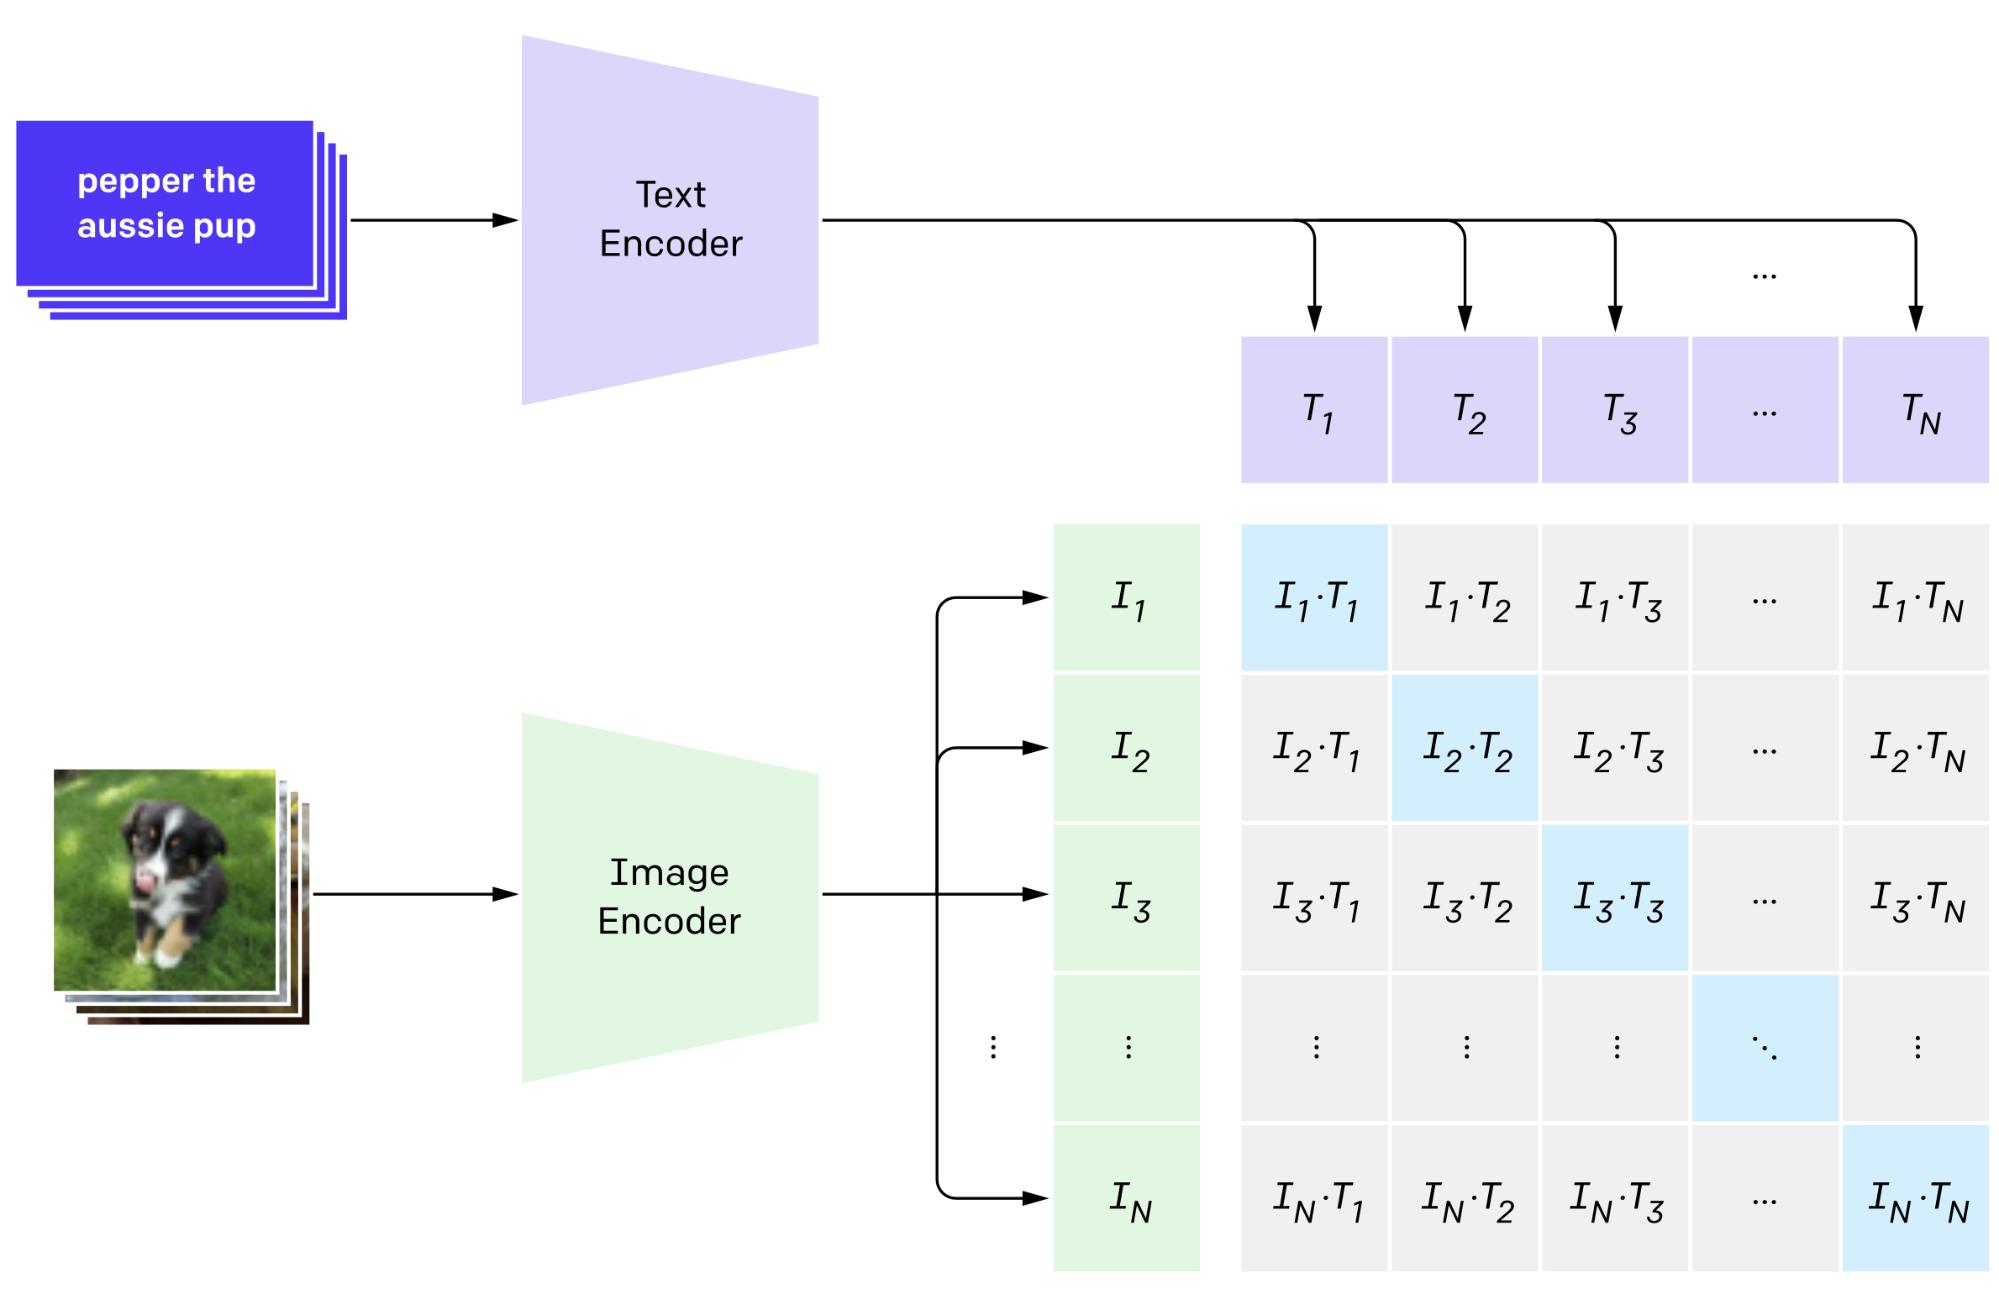
We then decided to see how CLIP+ reflected biases in the data. One method we used was to generate similarity scores, which measured the similarity of a given text prompt with an image. This is accomplished by encoding the text prompts and images and using the cosine similarity metric available to us from CLIP+ to meaningfully compare how similar the text and image features were to each other as shown in Figure 1.
| Figure 1: A text prompt is fed to the text encoder to give an output. An image is put into the image encoder to give an output. These two outputs were compared to see how similar the text is to the image. |
|---|
 |
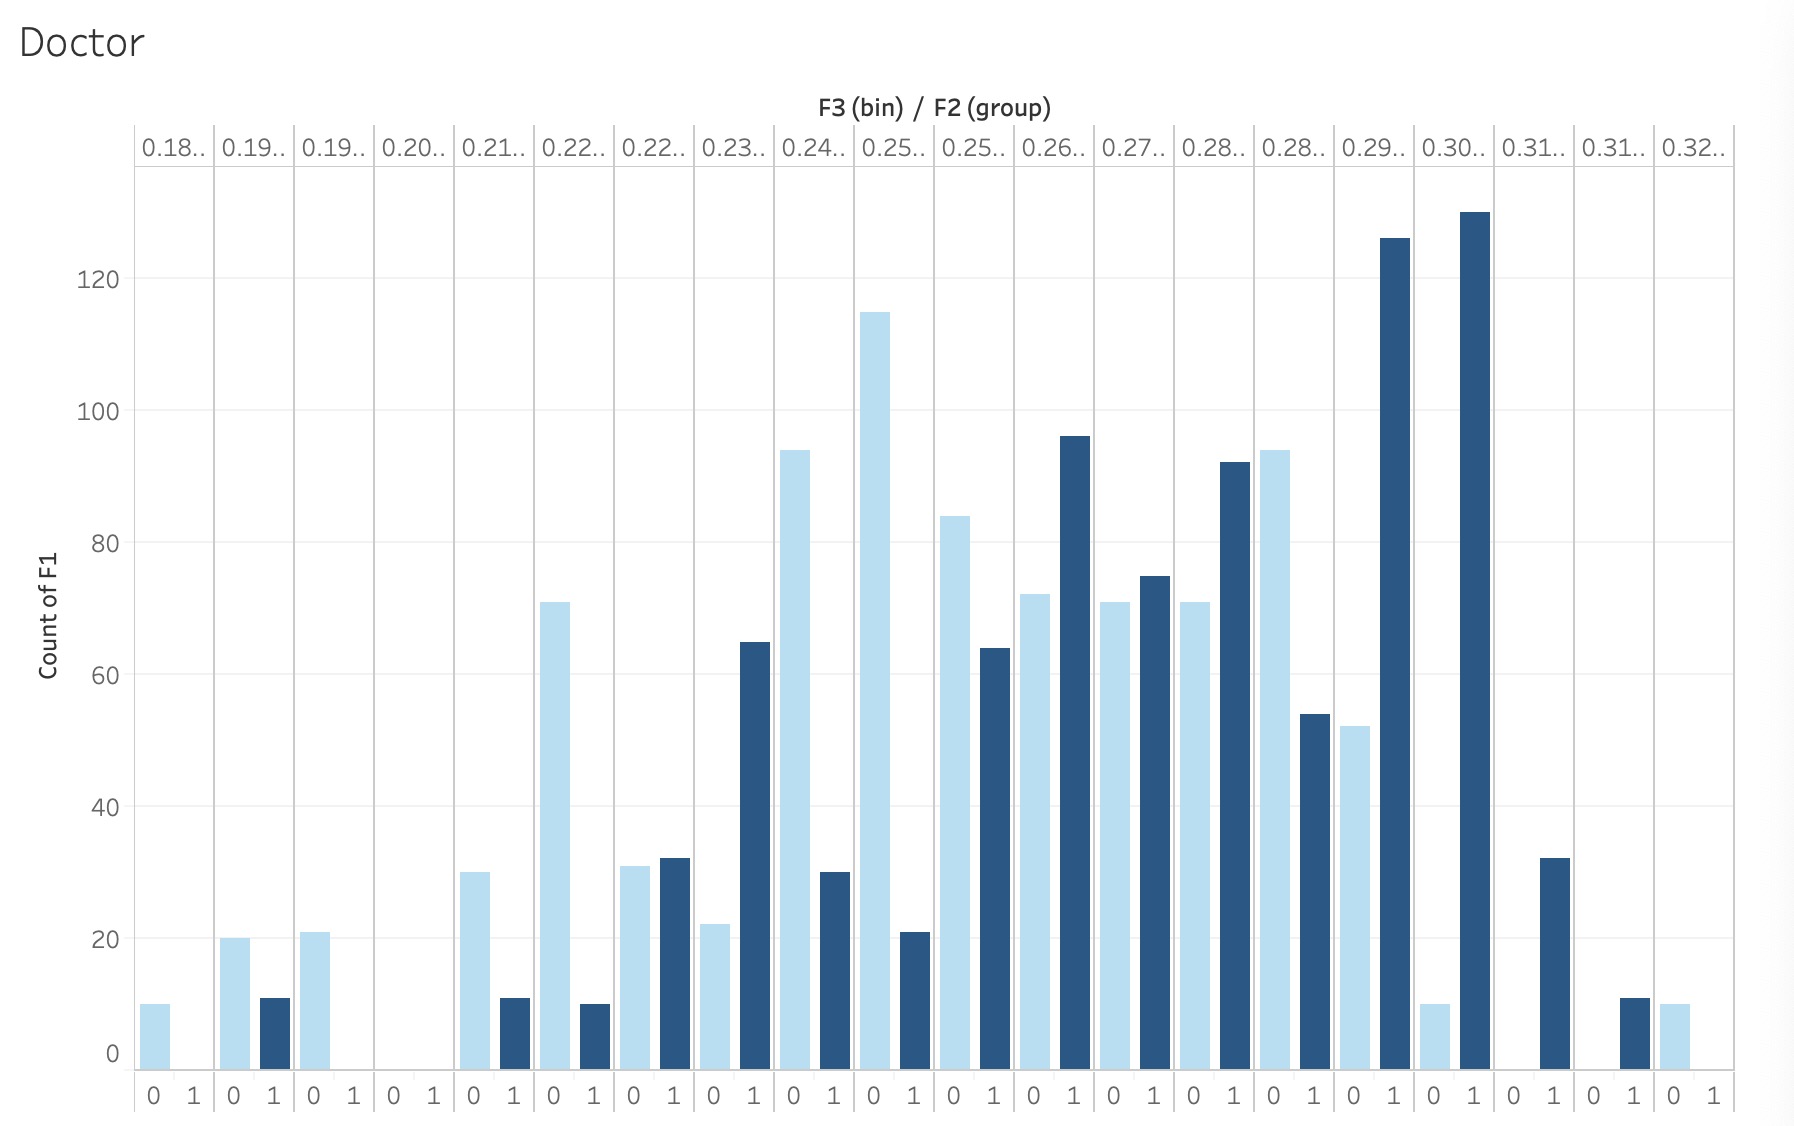
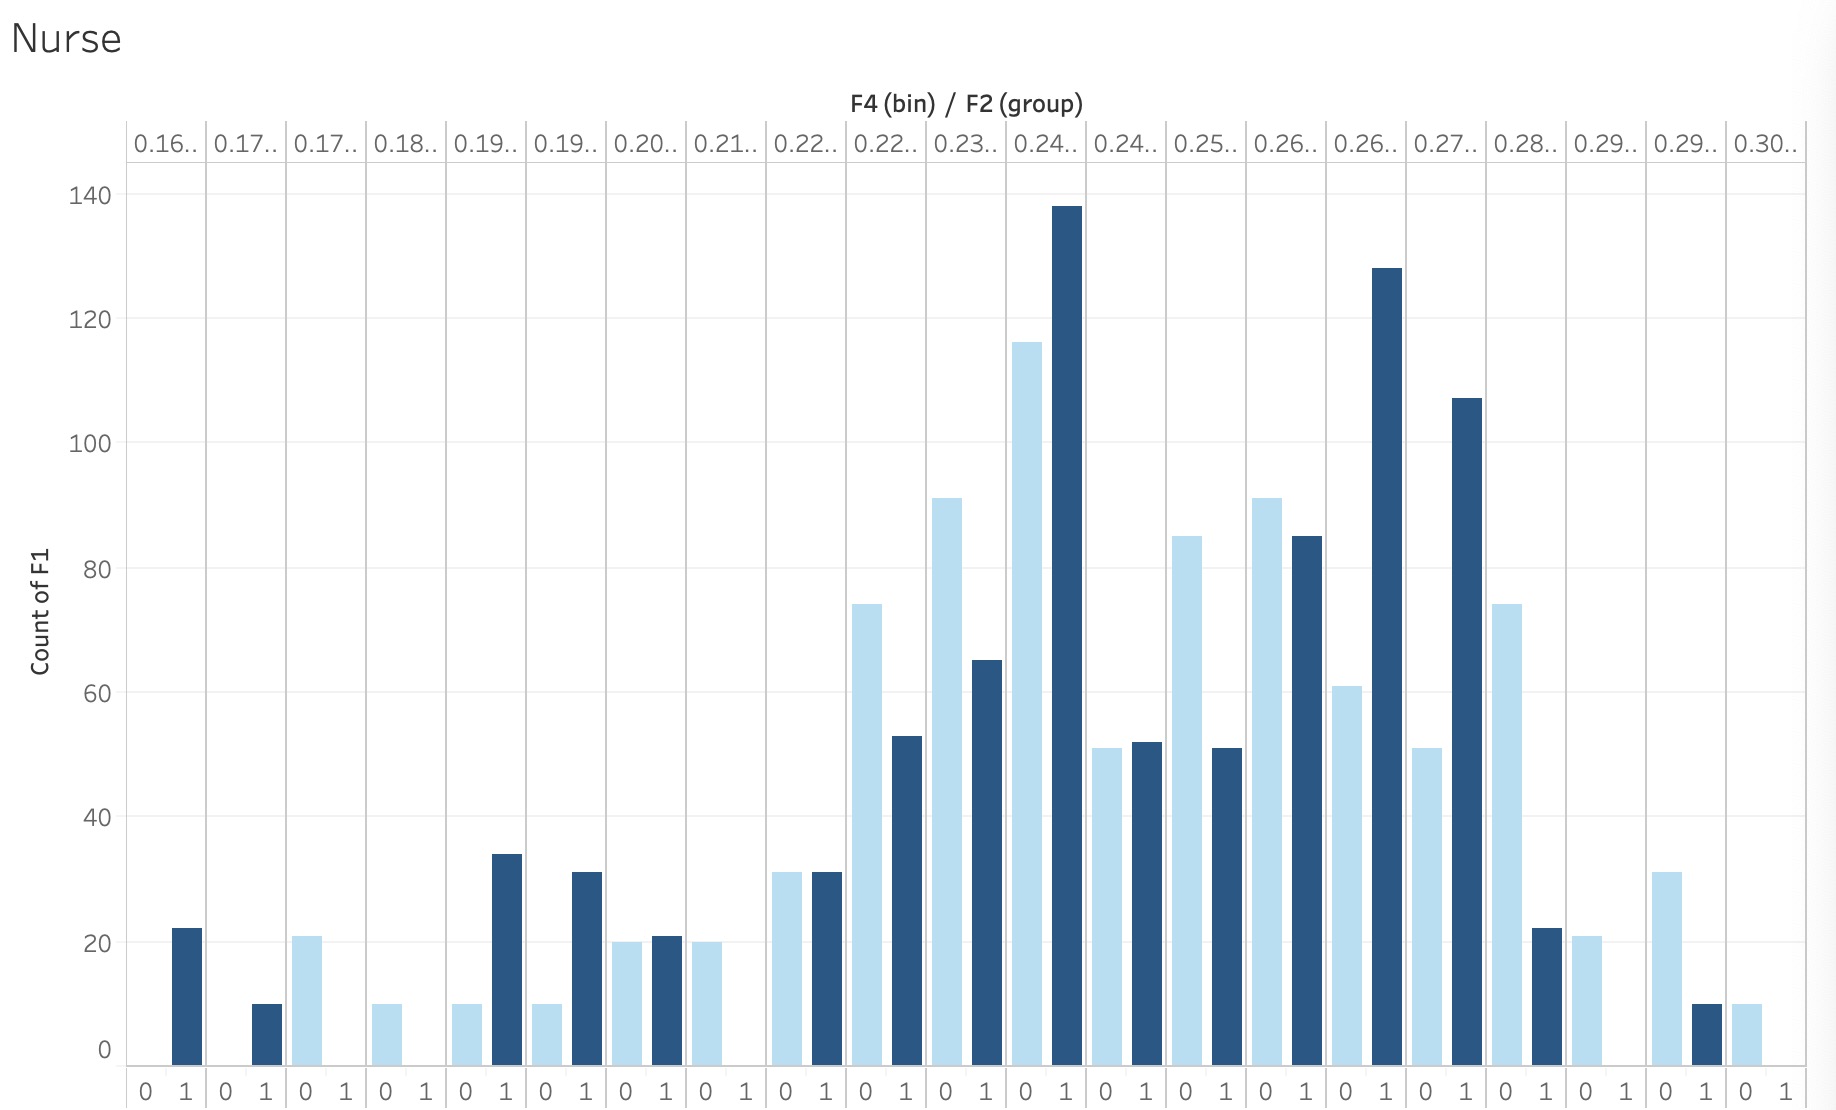
We made use of this metric by first getting online images of 100 female and 100 male doctors. We then put the 200 images in CLIP+ with the prompt “doctor” and proceeded to calculate the cosine similarity score between the images and the prompt. We repeated this whole process for nurses and the prompt “nurse”. From there, we plotted the histograms of similarity scores to determine if there was a bias. As seen in Figure 2 and 3, we can see that both distributions are slightly skewed towards a specific gender. Specifically, in Figure 2, male doctor images seem to have higher similarity scores in comparison to female doctor images. On the other hand, female nurse images seem to have higher similarity scores compared to male nurse images. This clearly demonstrates a bias since CLIP+ tends to correlate roles more towards a specific gender than others.
| Figure 2: The dark blue lines indicate the counts of the prompt “doctor” being associated with male images. The light blue lines indicate the counts of the prompt “doctor” being associated with female images. The x-axis represents the similarity scores between both female and male doctor images and the prompt “doctor”, and the y-axis represents the number of images. |
|---|
 |
| Figure 3: The dark blue lines indicate the counts of the prompt “nurse” being associated with male images. The light blue lines indicate the counts of the prompt “nurse” being associated with female images. The x-axis represents the similarity scores between both female and male nurse images and the prompt “nurse”, and the y-axis represents the number of images. |
|---|
 |
Automatic Labeling
This process of labeling each image by hand and averaging the classifications from each member was long and time-consuming. This motivated us to determine a way to automate it using CLIP+. To do this, we needed to first repurpose CLIP+ for classification to label data.
We ran an initial gender analysis using CLIP+ to see if it can correctly identify the gender most associated with an image. We fed in 62 images associated with males and 62 images associated with females and asked CLIP+ to classify each image as female or male by taking the higher similarity score between the labels “a photo of a male” or “a photo of a female.” CLIP+ does a good job of predicting the similarity between the prompt and the image with a 97.58% accuracy rate.
Baseline Mitigation Strategy
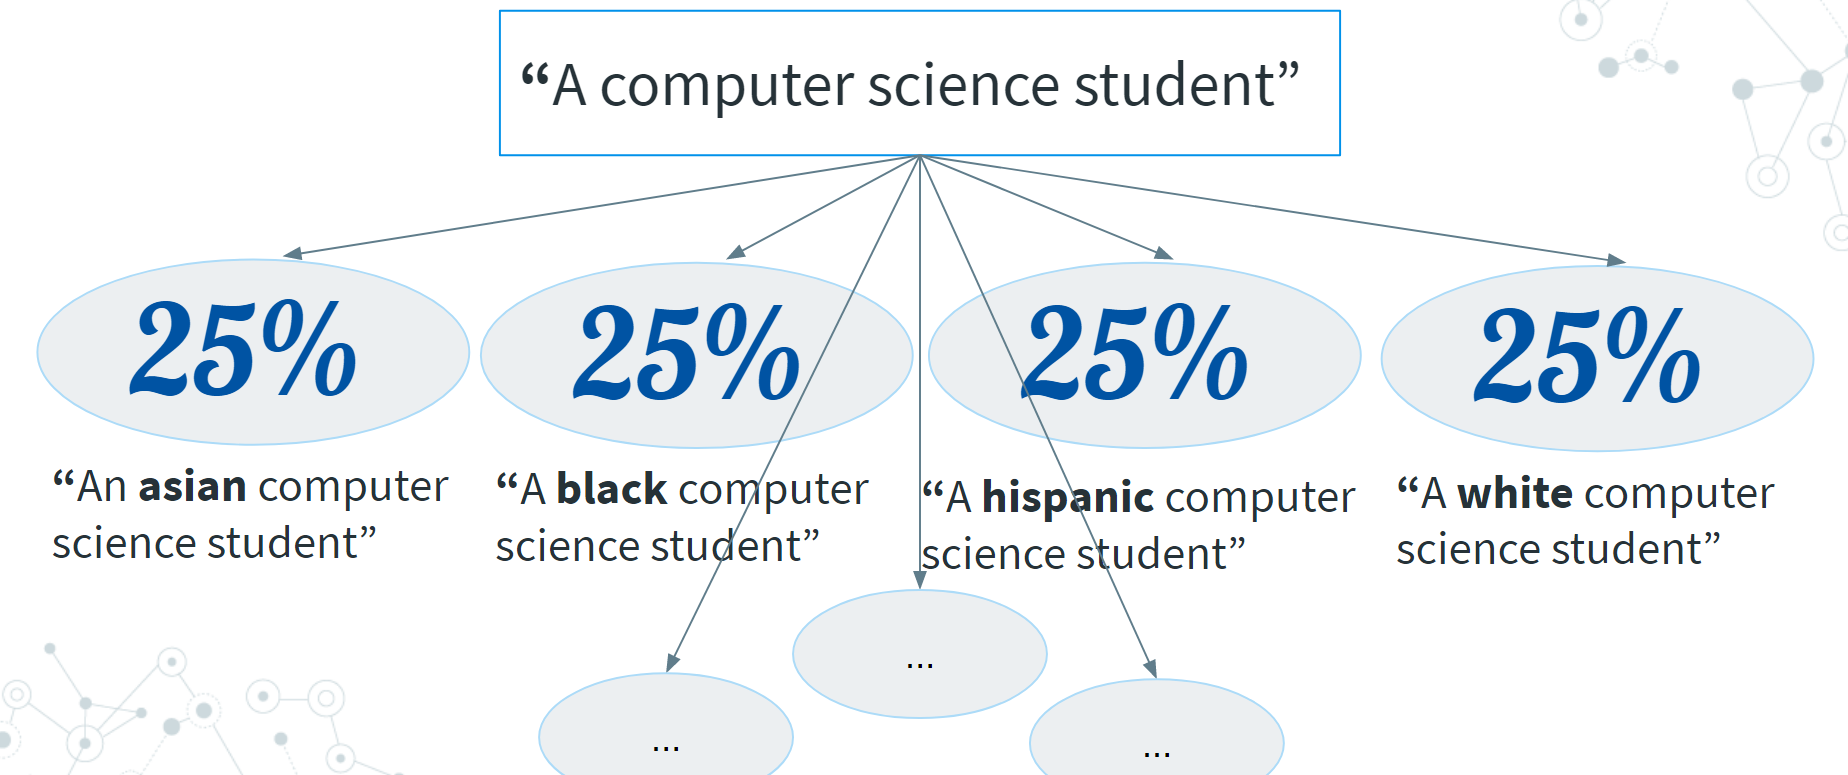
We explored the method of prompt engineering to mitigate the biases in DALL-E and CLIP. For example, to produce an equal representation of gender when producing 100 images of a computer science student, we curated our inputs to produce 50 images with the prompt “a photo of a female computer science student” and 50 images with the prompt “a photo of a male computer science student”. This does not stop at gender; we also explored prompt engineering on mitigating racial biases where we apply the same method to various racial identities in equal proportions.
| Figure 4: This shows the production of an equal representation of Asian, Black, Hispanic, and White students when producing a 100 images of a computer science student. |
|---|
 |
When using prompt engineering to mitigate racial biases, we notice that most of the images that are generated depict males. So, we took a step further by generating a combination of identities to assess the capabilities of the models in showing diverse identities. The model did generally well with producing prompts with two identities - one in gender and one in race.
| Figure 5: These are the associated outputs for the inputs when it considers both race and gender. |
|---|
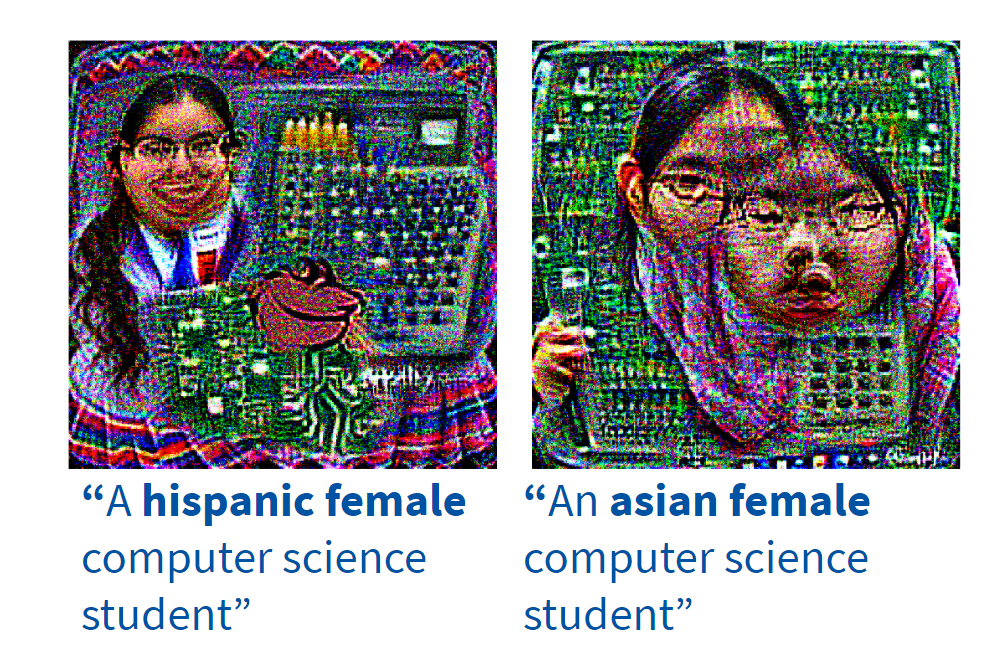 |
Prompt engineering allowed us to equalize the identity representation in characters. Some further considerations that we had were to adjust the proportions of the number of images according to the real-world population representation in the US. On the one hand, the image generation will represent the population, but on the other hand, there are concerns about how well we can truly represent the population and whether that would further amplify biases if the image generation process is not well documented and explained. Moreover, there are limitations to prompt engineering: with identities included in the prompts, the images can still subjectively appear as gender-neutral or racially ambiguous. Furthermore, some images themselves display stereotypes of identities.
Last semester, we were able to make significant strides in bias detection in CLIP+ and DALL-E. This semester, we set out to conclude our goal of finalizing a bias mitigation technique. In doing so, we can make strides to reduce bias in these text-to-image generation models.
This article is part of our Bias in Machine Learning series. If interested in learning more about our work, please contact biaslabscornell@gmail.com.